REPORTING & ANALYTICS
Reporting Overview
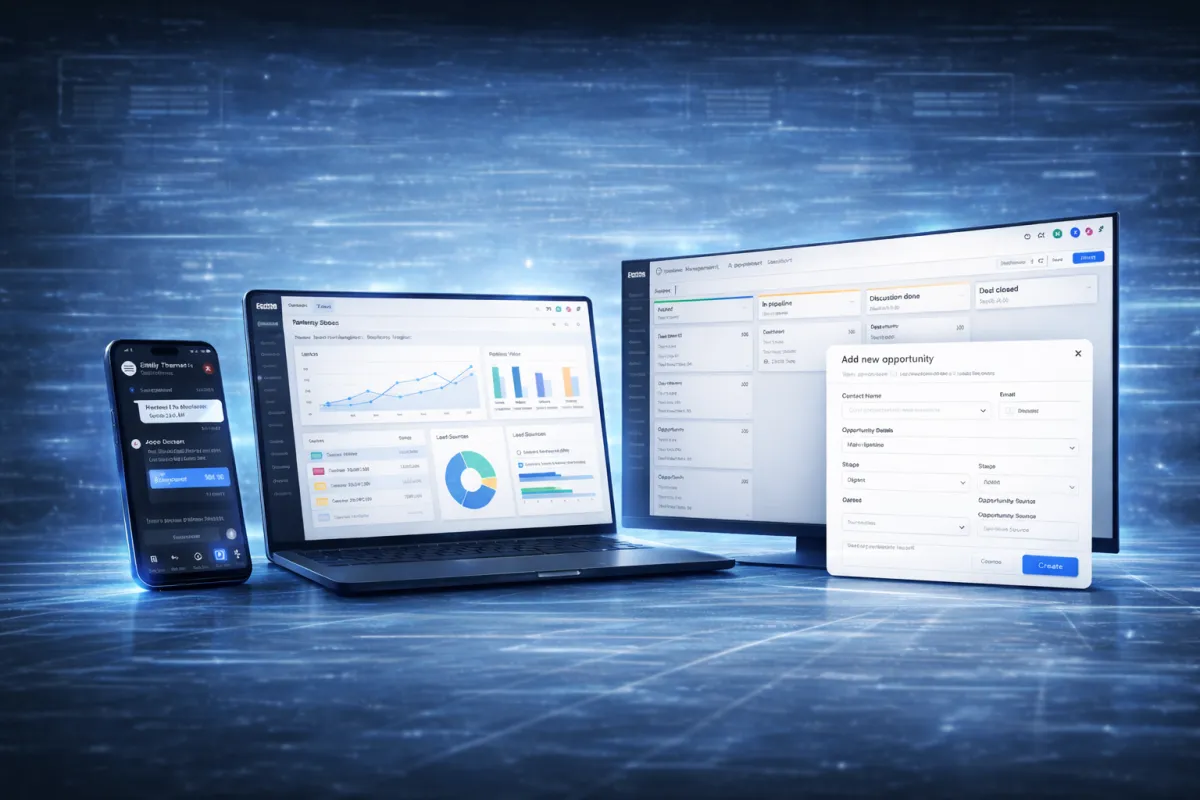
Learn how to read your reports, track performance, and understand key business metrics inside your dashboard.
Video training coming soon - step-by-step walkthroughs will be added here to guide you through reading and understanding your reports.
Quick Reporting Overview
Understand the most important reports available inside your dashboard.
Pipeline Reports
Track how leads move through your pipeline and monitor your conversion progress.
Appointment Reports
View scheduled appointments, completed bookings, and overall calendar activity.
Conversation Reports
Monitor message activity, response times, and communication trends.
Performance Metrics
Measure overall performance using key numbers such as bookings, conversions, and response rates.
HOW IT WORKS
Review Your Reports
Use this simple workflow to stay informed and make data-driven decisions.
Open Reporting Dashboard
Navigate to the reporting section inside your dashboard.
Review Pipeline Activity
Check how leads are moving through your pipeline stages.
Check Appointment Data
Monitor booked, completed, and missed appointments.
Analyze Communication Trends
Review messaging performance and customer response activity.
Identify Improvement Opportunities
Use report insights to improve response times, scheduling efficiency, and overall customer engagement.

Best Practices
These habits help you understand performance and improve results.
Review reports at least once per week
Monitor pipeline progress regularly
Watch for missed opportunities
Track response times
Use data to improve customer communication
Need Help Understanding Your Reports?
If you're unsure how to read your reports or understand your numbers, submit a support request and our team will guide you.